TABLE OF CONTENTS
- •Want to measure a change before it reaches production?
- •What SQLsimTools Is
- •Which Tool Answers Which Question
- •First Run: Connection Test and Concurrent Load
- •Before and After: A Measured Example
- •Mixed Workloads With a JSON File
- •Capture a Real Workload and Replay It
- •Moving From ostress
- •Before You Run It
- •How Aryasoft Uses Load Testing
- •Measure the change before your users do
Most SQL Server changes reach production with very little evidence behind them. A new index looks right in the execution plan, the compatibility level change passed a few smoke tests, the new server has more cores than the old one. Then the first busy Monday arrives, concurrency rises and the change behaves differently from what anyone saw on a quiet test system.
The fix is not more caution. It is measurement: run the same workload before and after the change, under realistic concurrency, and compare the numbers. SQLsimTools is a new free toolkit built for exactly that, and we tested it on our own SQL Server 2025 lab before writing this guide. Below you will find what it does, the commands we ran, the results we measured and the limits you should know before you trust a replay.
Want to measure a change before it reaches production?
Aryasoft measures the workload in a test environment during upgrade, migration and performance projects, and decides with a before-and-after comparison.
What SQLsimTools Is
SQLsimTools is an open-source set of tools for building a repeatable SQL workload, running it under controlled concurrency, measuring it and comparing runs. Version 1.0.0 was released on 14 October 2026 under the MIT license. It targets SQL Server 2019, 2022 and 2025, Azure SQL Database, Azure SQL Managed Instance and SQL database in Microsoft Fabric. The official project page is microsoft.github.io/sqlsimtools, and the source code, documentation and releases are on GitHub.
Note
SQLsimTools is published in Microsoft’s GitHub organization, but the project states that it is not an official Microsoft product and is not covered by Microsoft commercial support. Help comes from the documentation, GitHub Issues and Discussions. It is also in Public Preview, so treat it as a test tool, not as part of your production toolchain.
The toolkit offers four ways to work:
| Component | What it is | When to use it |
|---|---|---|
| sqlsim | Native C++ command-line tool built on ODBC Driver 18 | Scripts, automation, CI pipelines, lowest client overhead, Extended Events replay |
| sqlpysim | Python command-line tool built on the mssql-python driver |
Python-based automation; it has documented compatibility gaps with sqlsim |
| sqlsim Studio | Local browser app (Windows x64) | Visual configuration, live monitoring and side-by-side comparison of runs |
| Workload Builder | Agent skills for GitHub Copilot and other AI coding agents | Designing an experiment from a plain-language request |
sqlsim and sqlpysim run on Windows x64/ARM64 and Ubuntu 24.04/26.04 x64. Studio is currently Public Preview on Windows x64 only. The tools send no telemetry; the only network connection is to the SQL target you specify.
Which Tool Answers Which Question
SQLsimTools does not replace the tools most DBAs already use. Each tool answers a different question, and mixing them up leads to wrong conclusions:
| Question | Tool | What it measures |
|---|---|---|
| Can this storage carry a SQL Server workload? | DiskSpd | IOPS, throughput and latency at the storage layer, independent of SQL Server |
| Is the I/O path reliable under SQL Server-like patterns? | SQLIOSim | Simulated SQL Server I/O to expose integrity and stability problems in the disk subsystem |
| How does the platform compare on a standard benchmark? | HammerDB | TPC-derived OLTP (TPROC-C) and analytical (TPROC-H) workloads |
| How does one query behave under many threads? | SqlQueryStress | A single query or procedure with many threads, iterations and parameter values |
| How does our own mix of queries behave before and after a change? | SQLsimTools | Concurrent mixed workloads from your scripts or a captured trace, with per-query CPU, reads and elapsed time |
In our field work the first two matter more than people expect. Most production SQL Servers today run on shared virtualization and storage. When DMVs and wait statistics narrow a performance problem down to I/O, the next step is to prove that the disk itself is the bottleneck. Opening a vendor case or going to the virtualization team with IOPS, latency and queue depth figures from DiskSpd shortens that conversation considerably. We run the same tests before a new environment goes live, to confirm that its storage is fit to become production at all.
SQLsimTools works one layer higher. Once the platform is known to be healthy, it answers the question that matters for a change: does this workload get faster or slower?
First Run: Connection Test and Concurrent Load
Download the package from the project’s GitHub releases page and unblock the ZIP (the binaries are not code signed, so Windows may show a SmartScreen warning). sqlsim needs Microsoft ODBC Driver 18 for SQL Server. Start with a connection test:
.\x64\sqlsim.exe -S localhost -d master -E -Q "SELECT @@VERSION"Then run a script with concurrency. -n is the number of threads, -r the iterations per thread, -q suppresses result sets and -querystats collects per-query server statistics:
.\x64\sqlsim.exe -S sql01 -d SalesDB -E -i customer-orders.sql -n 8 -r 50 -q -querystats -json -o before.jsonFor SQL logins, pass the password on standard input with -P - so it never appears in the process list. If you supply a full ODBC connection string with -c instead, sqlsim uses it as is. In our test that also meant the application name became SQL Workload Simulator rather than sqlsim, which matters for the replay filter later in this guide; add APP=sqlsim to the connection string in that case.
Before and After: A Measured Example
To see what the output looks like on a real change, we built a throwaway database on our SQL Server 2025 test instance with a one-million-row dbo.Orders table and a typical application query:
-- customer-orders.sql: the query the application runs most often
DECLARE @CustomerID int = ABS(CHECKSUM(NEWID())) % 20000 + 1;
SELECT COUNT(*) AS OrderCount, SUM(Amount) AS TotalAmount, MAX(OrderDate) AS LastOrder
FROM dbo.Orders
WHERE CustomerID = @CustomerID;
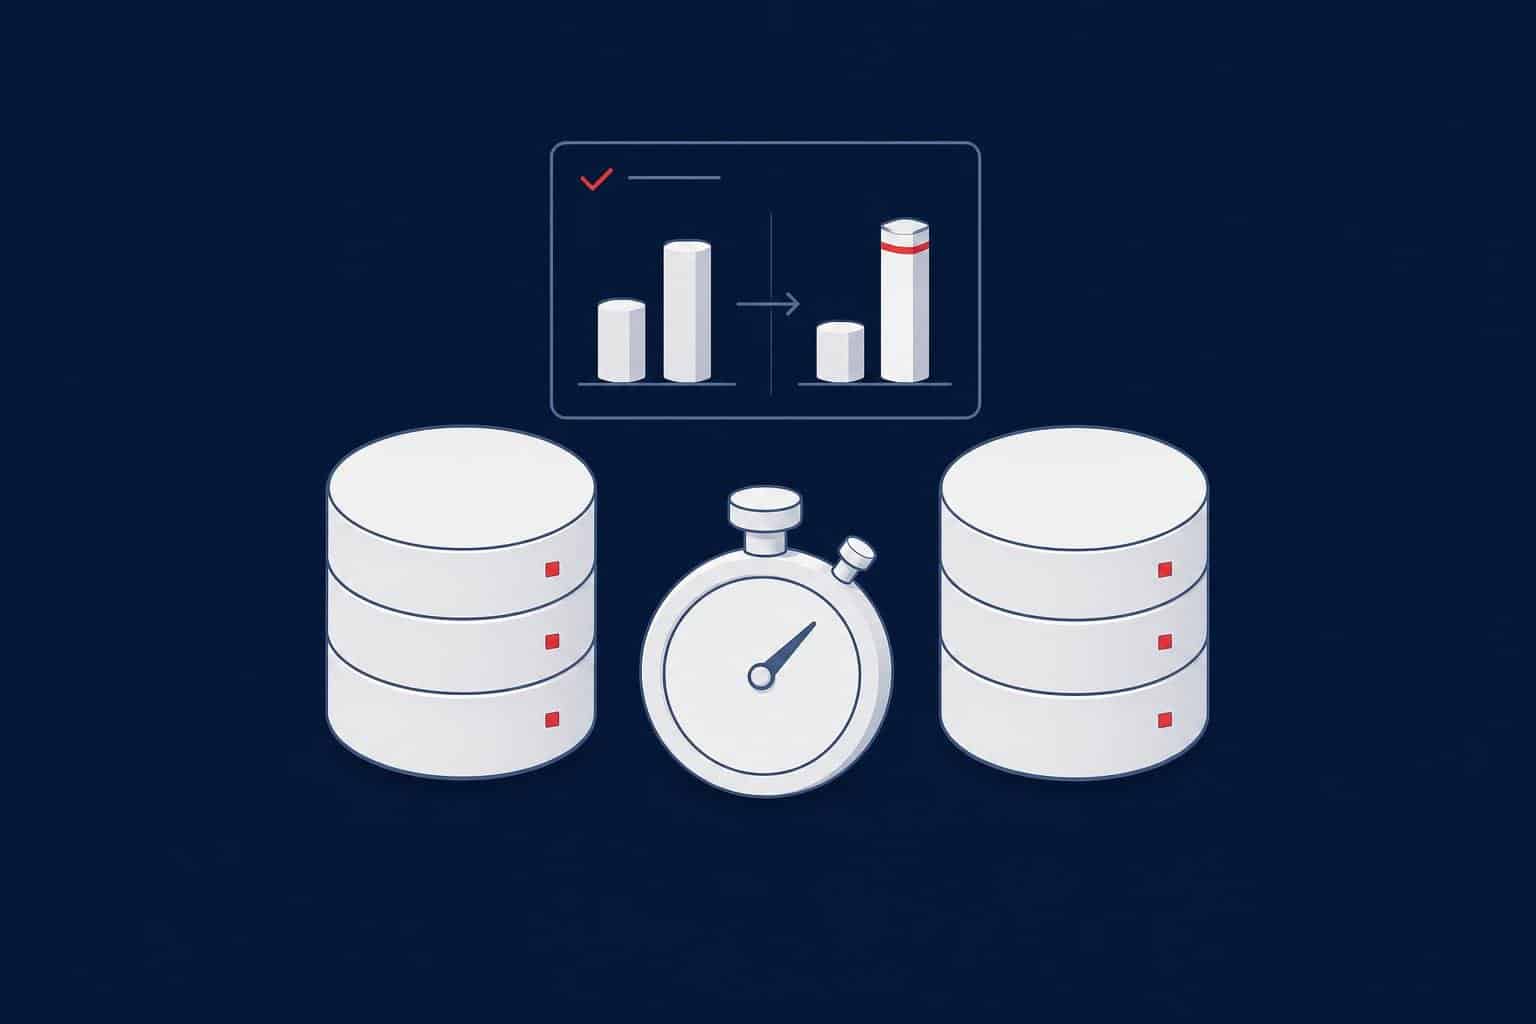
Instead of a fixed number of iterations, we used a duration-based workload file so that both runs get exactly the same time budget: 8 threads, 60 seconds. We ran it, added a covering index, and ran exactly the same file again:
{
  "duration_seconds": 60,
  "workloads": [ { "file": "customer-orders.sql", "threads": 8 } ]
}
.\x64\sqlsim.exe -S sql01 -d SalesDB -E -workload dur60.json -q -querystats -json -o before.json -stream-json > before.ndjsonCREATE INDEX IX_Orders_CustomerID
ON dbo.Orders (CustomerID)
INCLUDE (Amount, OrderDate);| Metric | Without index | With covering index |
|---|---|---|
| Queries completed in 60 s | 3,171 | 7,462 |
| Steady throughput | ~53 queries/s | ~127 queries/s |
| Elapsed time per query, measured by the client | 152 ms | 64 ms |
| Server CPU time per query | 76.1 ms | 0.26 ms |
| Logical reads per query | 4,098 | 3.2 |
| Total server CPU for the run | 241.4 s | 1.95 s |
| Failures | 0 | 0 |
The -stream-json switch writes a progress event every second. Plotting the difference between consecutive events gives the throughput curve of each run:
Queries completed per second, 8 threads, 60 seconds
Three lessons come out of these numbers. First, the logical reads and CPU columns tell you what the change did inside SQL Server; the improvement there is three orders of magnitude. Second, the client-side elapsed time only fell from 152 ms to 64 ms, because it also contains the network round trip between our workstation and the test server. Users feel the client number, the server pays the server number, and a good comparison reports both. The same distinction applies when you read wait statistics during a test: a query can be fast on the server and still slow for the user.
Third, look at the shape of the orange line. It sits almost flat at about 127 queries per second, and that ceiling is not SQL Server’s. With 8 threads and roughly 64 ms per round trip, the client cannot send more than about 125 queries per second (8 ÷ 0.064 s). After the index, the bottleneck moved from the server to the network. To find the server’s real limit you would add threads or run the load generator closer to the server. A single average would have hidden this; a fixed-duration run with a per-second curve shows it immediately.
Mixed Workloads With a JSON File
Real systems never run one query. The -workload option takes a JSON file with several groups, each with its own threads, iterations or duration and think time. The example below runs OLTP lookups, a heavier reporting group and a monitoring query at the same time:
{
  "workloads": [
    { "file": "sql\\oltp-lookups.sql",   "threads": 4, "iterations": 100 },
    { "file": "sql\\monthly-report.sql", "threads": 2, "iterations": 10 },
    { "queries": [ "SELECT COUNT(*) FROM sys.dm_exec_sessions WHERE is_user_process = 1" ],
      "threads": 1, "iterations": 50 }
  ]
}
.\x64\sqlsim.exe -S sql01 -d SalesDB -E -workload mixed.json -q -json -o mixed-before.jsonThe sample workload that ships with the tool ran 3,020 batches on 7 threads against AdventureWorksLT in 54 seconds on our lab instance, with no errors. Mixing groups like this is what exposes blocking and resource contention that a single-query test never shows.
Capture a Real Workload and Replay It
Scripts you write yourself only contain the queries you thought of. Replay closes that gap: you capture real traffic with Extended Events, convert it, and run it against another server or another configuration. The workflow has four steps:
- Capture. Create an event session with
sql_batch_completed,rpc_completed,loginandlogout, with thesession_idanddatabase_nameactions, writing to an event file. The project ships ready-made setup and stop scripts. - Convert.
replay\convert-xel.ps1reads the.xelfile throughsys.fn_xe_file_target_read_file()and writes a replay XML file. - Replay.
-replay fastopens one connection per original session and replays its events in captured order, as fast as possible.-replay stressflattens all events and runs them across-nthreads for-riterations. - Compare. With
-querystats -json, the output contains both the original captured metrics and the replay measurements per query.
.\replay\convert-xel.ps1 -XelFile "D:\xe\capture*.xel" -OutputFile trace.xml -ServerName sql01
.\x64\sqlsim.exe -S sql02 -d SalesDB -E -replay fast -replayfile trace.xml -querystats -json -o replay-sql02.json -q
We captured 50 batches from 6 sessions on the lab instance, replayed the trace once with the index in place and once after dropping it. The second query in the trace, a report that does not use the index, serves as the control:
| Query in the trace | Replay with index | Replay without index |
|---|---|---|
| Customer order summary (40 runs) | 3.1 reads, 2 ms CPU, 82 ms | 4,098 reads, 72 ms CPU, 186 ms |
| Closed-order report (10 runs) | 4,152 reads, 120 ms CPU | 4,152 reads, 126 ms CPU |
All 50 events completed without errors in both runs. The control query stayed flat while the customer query regressed sharply, which is exactly the signal you want before a cutover: a missing index on the new server, a changed plan after a compatibility level change or a parameter sniffing problem shows up as a per-query difference instead of a vague “the new server feels slower”.
Warning
Replay reproduces statements, not the application. The project’s own documentation states that it does not restore transaction boundaries, think time, connection state or session-level SET options; INSERT BULK events fail because the data is not in the trace; and a replay file is limited to 100 MiB and 100,000 events. A trace that contains writes changes data when you replay it, so run it only against a restored copy, and treat stress results as a transformed load, not a like-for-like reproduction.
When you migrate to a new server or follow the upgrade guide to SQL Server 2025, replaying a captured business-hours sample against the old and the new environment is one of the cheapest ways to find regressions before users do.
Moving From ostress
SQLsimTools is positioned as a successor to ostress, the long-standing RML Utilities load tool. The main differences, from the project’s comparison:
| Area | sqlsim | ostress |
|---|---|---|
| Driver | ODBC Driver 18 | SQL Server Native Client (deprecated) |
| Authentication | Windows, SQL, Microsoft Entra (interactive, MSI, token) | Windows and SQL |
| Encryption | TDS 8.0 strict, mandatory or optional | TDS 7.x |
| Availability groups | Read-only intent (-R), multi-subnet failover (-M) |
Not supported |
| Output | Timestamped text and JSON | Text, optional XML |
| Replay | Extended Events trace | RML replay files |
Most switches carry over unchanged (-S -d -E -U -P -i -n -r -q -v -l -t), but a few changed meaning. -p enables prepared statements in sqlsim and sets the packet size in ostress; -M is multi-subnet failover in sqlsim and max threads in ostress; stop-on-error is -stoponerror instead of -b. Review existing ostress scripts line by line rather than renaming the executable.
Before You Run It
- Never point it at production without the owner’s agreement. It runs the SQL you give it at the concurrency you ask for. Start small and scale threads and iterations gradually.
- Turn certificate validation on. Like
sqlcmd(Go), sqlsim does not validate the server certificate unless you ask. For Azure SQL and any connection that leaves your machine, use-N mor-N s. - Keep secrets off the command line. Use
-P -or-T -to pass passwords and tokens on standard input. - Protect saved configurations. Studio never stores secrets, but saved files contain query text and server names in plain text.
- Fix the platform first. A load test on storage that already fails a DiskSpd baseline only measures the storage. Check the disk layer with the guidance in our disk storage best practices first.
How Aryasoft Uses Load Testing
Load testing is part of how we de-risk upgrades, migrations and performance work. At the storage layer we use DiskSpd and SQLIOSim to confirm whether a new environment can carry production, and to give virtualization and storage teams hard IOPS, latency and queue figures when a problem has been traced to I/O. For platform comparisons we use HammerDB, and for a single problem query SqlQueryStress. SQLsimTools adds what was missing between them: a repeatable, measurable before-and-after comparison of the customer’s own workload, from scripts or from a captured trace.
The goal is always the same. A change goes live because the numbers say it is better, not because it looked fine on a quiet test system.
Related Reading
- SQL Server Wait Statistics: A Practical Diagnostic Workflow
- SQL Server Extended Events: A Practical Guide to Sessions, Targets and Analysis
- SQL Server Migration with Minimal Downtime: Methods, Cutover Runbook and Rollback
- SQL Server Indexes: Types, Design Rules, Missing and Unused Indexes, and Maintenance
SQL Server Performance
Measure the change before your users do
Aryasoft plans and runs load tests for upgrades, migrations and performance projects, from the storage layer to your own workload, and reports the before-and-after numbers.