TABLE OF CONTENTS
- •The right alerts at the right time
- •What Makes a Good Alert Matrix
- •Severity Levels
- •The Alert Matrix: Common Metrics
- •SQL Server-Specific Alerts
- •PostgreSQL-Specific Alerts
- •Preventing Alert Fatigue
- •An Alert Matrix Is a Document, Not a Tool
- •24/7 Monitoring with Aryasoft
- •Frequently Asked Questions
- •Sources
- •24/7 monitoring, real response
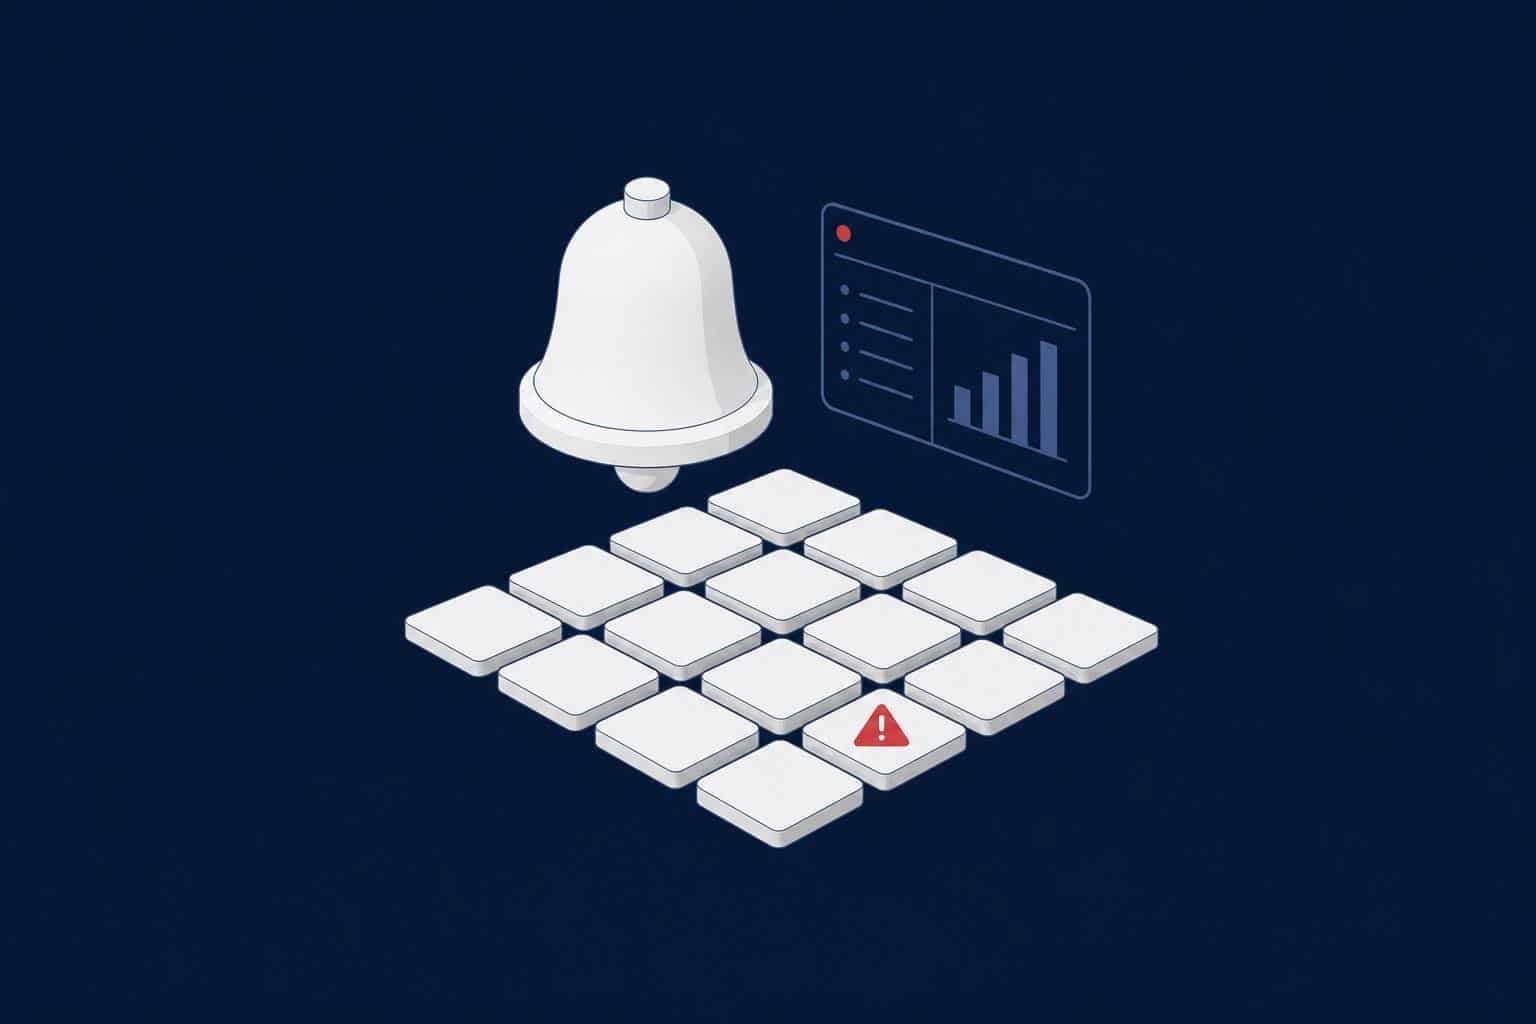
A DBA alert matrix is a document that defines, in a single table, which metric raises an alert at which threshold in your database monitoring, how severe that alert is and who does what when it fires. A good alert matrix prevents two failures at once: a critical problem that never raises an alert, and a team that misses the real problem among trivial alerts.
This guide explains how to build an alert matrix for SQL Server and PostgreSQL environments. The suggested thresholds are a starting point; tune them to your own system’s normal behavior (its baseline).
The right alerts at the right time
Aryasoft builds the alert matrix for your databases with you; under the SLA model, alerts open tickets automatically and are resolved by the on-call engineer.
What Makes a Good Alert Matrix
| Quality | What it means |
|---|---|
| Every alert needs an action | If there’s nothing to do when it fires, it isn’t an alert but a report line. |
| Severity is clear | A critical alert wakes someone up at night; a warning is handled during business hours; info is only recorded. |
| Ownership is defined | For every alert, it’s clear who responds and within what time. |
| Thresholds fit the system | A value that’s normal on one server can signal a crisis on another. |
| It’s reviewed regularly | Alerts that never fire, or fire constantly and get ignored, are weeded out. |
Severity Levels
| Level | What it means | Expected response |
|---|---|---|
| Critical | The service is down or will be within minutes; there’s a risk of data loss. | Immediate response, night included |
| High | The service is up but degrading; it can turn critical within hours. | Same day, after hours too |
| Warning | The trend is bad; it can cause a problem within days. | Planned work during business hours |
| Info | For the record and trend analysis | Reviewed in the weekly or monthly report |
The Alert Matrix: Common Metrics
The table below lists the core alerts that apply to both SQL Server and PostgreSQL. The thresholds are starting suggestions.
| Metric | Warning | Critical | When it fires |
|---|---|---|---|
| Service availability | — | Can’t connect to the database service | Service state, error log, recent changes; outage procedure |
| Disk usage (data, log, backup) | 80% | 90%, or projected to fill within 24 hours | Find the growing file; log backup or free space; capacity plan |
| Last successful full backup | 1 day later than scheduled | 2 days later than scheduled | Backup job error; target disk; start the backup by hand |
| Last log / WAL backup | Half the RPO target | RPO target exceeded | Log backup job or archiving error; watch log file growth |
| Replication lag | Several times the normal value | Lag beyond the RPO target | Network, standby disk latency, long transactions |
| Blocking | A session waiting more than 1 minute | More than 5 minutes, or the chain is growing | Find the session at the head of the chain; decide together with the application owner |
| Long-running transaction | Open for more than 30 minutes | Open transaction preventing log/WAL reuse | Find the session owner; assess the transaction |
| CPU usage | Above 80% for 15 minutes | Above 95% for 15 minutes | Top CPU queries; plan changes; new release |
| Disk latency | Average read or write above 20 ms | Above 50 ms and persisting | Which file; take the metrics to the storage or virtualization team |
| Connection count | 80% of the limit | 95% of the limit | Connection leak; idle sessions; pool settings |
| Error log | Repeated login failures | Corruption, I/O or memory errors | Procedure by error type; for corruption, check backups first |
Warning
Don’t define disk thresholds as percentages alone. 90% full on a 10 TB disk leaves 1 TB, which may last for weeks; a 100 GB log disk can fill up in minutes. Where you can, use trend-based alerts such as “projected time to full”.
SQL Server-Specific Alerts
| Alert | Why it matters |
|---|---|
| Errors 823, 824, 825 | Signs of I/O and page corruption. 825 means a read succeeded only after a retry, and is often the first sign of an approaching disk problem. |
| Severity 19–25 errors | Serious errors caused by resources, software or hardware |
| Last successful DBCC CHECKDB | If consistency checks haven’t run for longer than planned, corruption is found late. |
| Agent job failures | Backup and maintenance jobs can fail silently. |
| Always On synchronization state | NOT SYNCHRONIZING, or growing send and redo queues |
| Deadlock count | A sudden rise can signal a new application release or a plan change. |
| tempdb usage | A full tempdb affects the whole instance. |
SQL Server Agent alerts for errors 823, 824 and 825 take only a few lines. The example below creates the alerts; for notifications you need to define an operator and attach it with sp_add_notification:
USE msdb;
EXEC dbo.sp_add_alert @name = N'Error 823 - I/O error',
     @message_id = 823, @severity = 0, @include_event_description_in = 1;
EXEC dbo.sp_add_alert @name = N'Error 824 - Logical consistency error',
     @message_id = 824, @severity = 0, @include_event_description_in = 1;
EXEC dbo.sp_add_alert @name = N'Error 825 - Read retry',
     @message_id = 825, @severity = 0, @include_event_description_in = 1;
EXEC dbo.sp_add_alert @name = N'Severity 024 - Fatal hardware error',
     @severity = 24, @include_event_description_in = 1;
We cover which alerts to enable and how to set up operators in detail in our SQL Server alerts guide.
PostgreSQL-Specific Alerts
| Alert | Why it matters |
|---|---|
| Transaction ID age (wraparound) | If the age approaches autovacuum_freeze_max_age, autovacuum isn’t keeping up; in the worst case the database stops accepting new transactions. |
| Inactive replication slots | An unused slot keeps accumulating WAL until the disk fills. |
| WAL archiving failures | Failed archiving silently removes your ability to restore to a point in time. |
| Idle open transactions | “idle in transaction” sessions block VACUUM. |
| Dead tuple ratio | Dead tuples growing fast on busy tables mean the autovacuum settings aren’t enough. |
| Failover event | Patroni or the cluster manager changed the leader; the cause needs investigating. |
For example, these queries for transaction ID age and inactive slots can be added to your monitoring system:
-- Transaction ID age as a percentage of autovacuum_freeze_max_age
SELECT datname,
       age(datfrozenxid) AS xid_age,
       round(100.0 * age(datfrozenxid) / current_setting('autovacuum_freeze_max_age')::int, 1) AS pct_of_freeze_max
FROM pg_database
ORDER BY xid_age DESC;
-- Inactive replication slots and the WAL they retain
SELECT slot_name, active,
       pg_size_pretty(pg_wal_lsn_diff(pg_current_wal_lsn(), restart_lsn)) AS retained_wal
FROM pg_replication_slots
WHERE NOT active;
Preventing Alert Fatigue
Too many alerts can be more dangerous than none: the team gets used to the constant stream of notifications and ignores the critical one too. To prevent this:
- Add a duration condition: use conditions like “for 15 minutes” instead of momentary CPU spikes.
- Group repeats: don’t send a new notification every minute for the same problem.
- Define maintenance windows: silence expected alerts during planned work.
- Review monthly: report how often each alert fired and how many times it needed real action.
Tip
Attach a short “check first” note to every alert. When the engineer who gets the alert at 3 a.m. knows what to check in the first five minutes, response time drops directly. Over time these notes become your team’s most valuable runbook.
An Alert Matrix Is a Document, Not a Tool
Which monitoring tool you use is a decision that comes after the alert matrix. First define what is watched, at which threshold and by whom; then choose a tool that can implement that matrix. You’ll find daily, weekly and monthly checks in our SQL Server monitoring checklist, and the first steps during an outage in our first 30 minutes runbook.
24/7 Monitoring with Aryasoft
Under Aryasoft’s SLA model, monitoring runs 24/7/365: alerts open tickets automatically, an engineer from the on-call team resolves them and every incident appears in the monthly report. The team is made up of an account manager, a technical team and an on-call team. First response is 30 minutes during business hours and 2 hours after hours. We build the alert matrix with you on day one, based on your systems’ normal behavior. Details are on our managed database services page.
Frequently Asked Questions
Sources
The technical details in this guide were checked against the following official documentation in November 2026.
- Microsoft Learn: MSSQLSERVER_825
- Microsoft Learn: MSSQLSERVER_824
- Microsoft Learn: Database engine error severities
- Microsoft Learn: sp_add_alert
- PostgreSQL documentation: Routine Vacuuming
- PostgreSQL documentation: pg_replication_slots
Database Monitoring
24/7 monitoring, real response
Under Aryasoft’s SLA model, alerts open tickets automatically, the on-call engineer resolves them and every incident appears in the monthly report.